
Dr. Martin Kraska가 작성한 Technisches Rechnen mit SMath Erste Schritte은 SMath의 간략 설명서이다. 원문은 아래 링크를 참고하자. https://doi.org/10.25933/opus4-2947 이를 바탕으로 한글로 옮기는 작업을 했다. 문서 작성은 환경은 다음과 같다. Windows 11 Texlive2023 TeXstudio document class : Oblivoir 아래는 Technisches Rechnen mit SMath의 한글판이다. 원문과 좀 다른점 1. 원문에서는 언어설정을 독일어로 하고 있는데, 한글판에서는 영어로 설정하였다. 2. 원문에서는 각 단원별 소목차가 있으나, 한글판에서는 이를 제외하였다. 3. SMath로 직접 입력한 ..

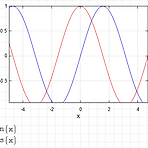 X-Y plot legend 표시
1. Insert > Plot > X-Y plot sin(x)와 cos(x)를 입력한다. 2. 그래프를 더블클릭하거나, 마우스 오른쪽 클릭해서 Format..선택 2-1. Legend \ IsLegendVisible True로 바꾼다. 그러면 다음과 같이 우측 상단에 빈 legend가 나타난다. 3. 빈 Legend에 sin(x), cos(x)나타내는 방법 3-1 Traces 클릭 3-2. Trace 속성(P) Name에 Legend 이름을 입력한다. 여기서는 sin(x), cos(x) 3-3 다음과 같이 Legend가 나타난다. setprop("XYPlot.Legend.IsLegendVisible",0)= 을 입력하면 spread sheet안에 있는 모든 xyplot의 legend가..