티스토리 뷰
1. Insert > Plot > X-Y plot
sin(x)와 cos(x)를 입력한다.

2. 그래프를 더블클릭하거나, 마우스 오른쪽 클릭해서 Format..선택
2-1. Legend \ IsLegendVisible True로 바꾼다.
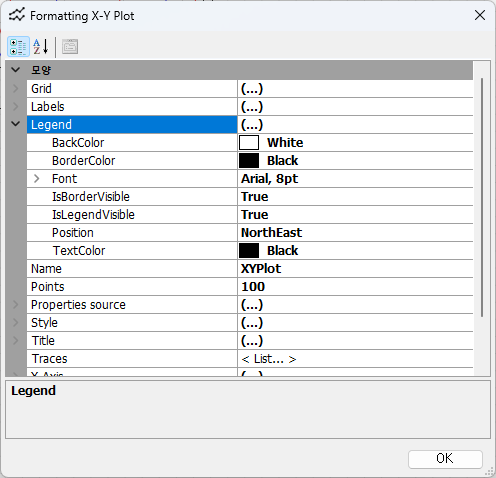
그러면 다음과 같이 우측 상단에 빈 legend가 나타난다.

3. 빈 Legend에 sin(x), cos(x)나타내는 방법
3-1 Traces < List...> 클릭

3-2. Trace 속성(P) Name에 Legend 이름을 입력한다.
여기서는 sin(x), cos(x)

3-3 다음과 같이 Legend가 나타난다.

setprop("XYPlot.Legend.IsLegendVisible",0)= 을 입력하면 spread sheet안에 있는 모든 xyplot의 legend가 사라진다.
setprop("XYPlot.Legend.IsLegendVisible",1)= 을 입력하면 spread sheet안에 있는 모든 xyplot의 legend가 나타난다.
자세한 내용은 아래 link를 참고하자.
https://en.smath.com/forum/yaf_postsm82993_X-Y-Plot-Region.aspx
반응형
LIST
'SMath' 카테고리의 다른 글
| Technical computing with SMath-First steps (0) | 2023.11.23 |
|---|---|
| disappear side panel (0) | 2023.11.20 |
| Exploring SMath (0) | 2023.09.29 |
| 원곡선 종거 (0) | 2023.09.27 |
| Rootof function (0) | 2023.09.27 |